In 2020 and 2021, citizens of the United States who were found eligible received three stimulus checks of $1200-2400 twice, and $600, respectively. These were given as a result of the passage of the CARES Act (total cost was $900 billion), The Revised Heroes Act (2.2 trillion) and the American Rescue Plan ($2.2 trillion). These bills also increased the amount given by unemployment insurance by $300-$600 per week for those who qualified. The expansionary policies seemed due to the appearance of a recessionary gap caused by people fearful of returning to shops and workplaces during the pandemic. Did this monetary policy work?(1)
First let me define some terms. A recessionary gap happens when aggregate output is below potential output, and can occur due to a negative demand shock. A negative demand shock is an event which reduces the demand for all goods and services, and shifts a short run aggregate demand (SRAD) curve to the left. The SRAD curve shows the relationship between the aggregate price level and the quantity of aggregate output demanded by purchasers. The short-run aggregate supply (SRAS) curve shows the relationship between the aggregate price level and the quantity of aggregate output supplied in the economy. A short run means that at least one input has a fixed cost. A long run means there are only variable costs. A negative supply shock shifts an SRAS curve to the left. SRAD and SRAS are two ways to determine causes of inflation. Both SRAS and SRAD are at equilibrium when they cross at the line of Long Run Aggregate Supply (LRAS),seen below. The LRAS shows the relationship between the aggregate price level and the quantity of aggregate output supplied that would exist if all prices including nominal wages, were fully flexible.(2)
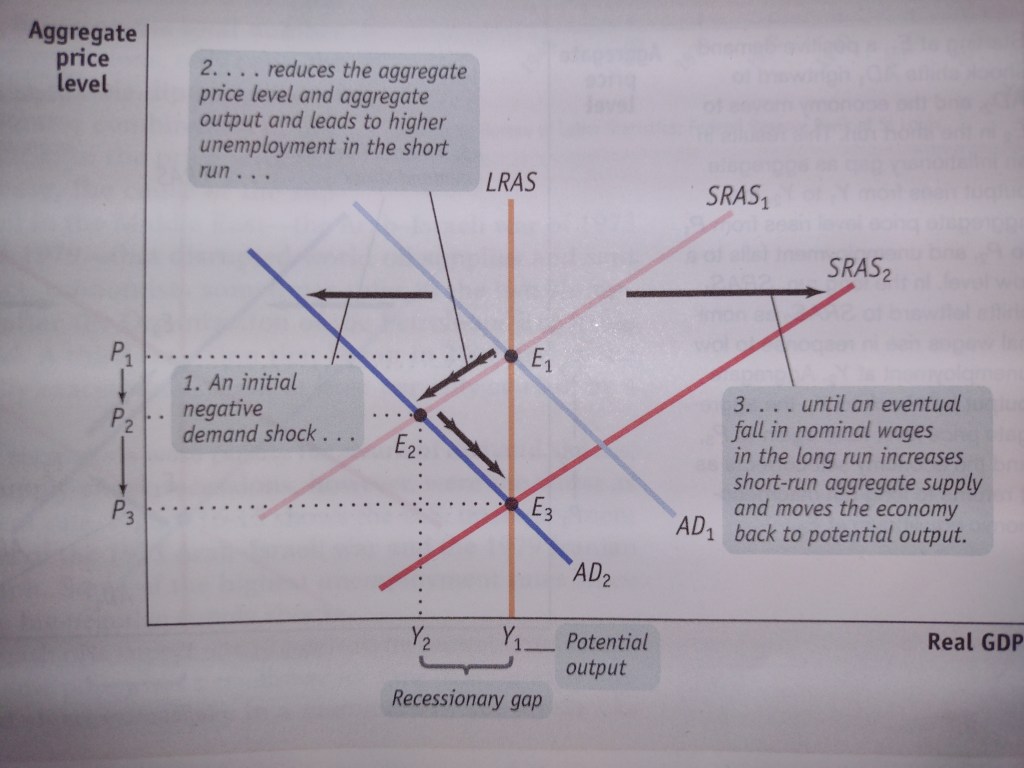
Graph 1- Short-run vs Long-run effects of a negative demand shock(2)
During a pandemic, the pessimism of consumers and firms increases, reducing AD. When a government increases spending or cuts taxes, the AD curve is expected to shift to the right. If interest rates fall, AD rises. When the stock of physical capital increases, the AD curve is expected to shift to the left. Just how much this occurred, and in what balance fiscal and monetary policy would help to stabilize the economy will be examined below.(2)
The aim of governmental fiscal policy is to fix a recession gap. The job of monetary policy is to avoid “twin evils” of inflation and high unemployment. Policies to control inflation can worsen unemployment and policies aimed at reducing unemployment can cause inflation. Regularly, when unemployment is high, nominal wages and other sticky prices fall, ultimately leading producers to increase output. As a result, a recessionary gap causes the short-run aggregate supply curve to gradually shift to the right over time, bringing the economy back to equilibrium. Both types of output gaps tends towards zero, and so the economy is self-correcting in the long run. The process of self-stabilization for the economy can typically take a decade or more and the economy can suffer an extended period of depressed aggregate output and high unemployment before it returns to normal. This is the rationale for an active stabilization policy.(2)
Governments often respond to recession by increasing spending, cutting taxes, or both. Changes in either tax rates or government transfers usually influence the economy indirectly, through their effect on disposable income. In the past, governments have increased spending to get out of The Great Depression, and more recently The Great Recession. The US did this by financing construction of infrastructure. The Great Depression saw a sharp decline in aggregate demand. The Great Depression was ended by a positive demand shock.(2)
In 2009 Obama passed the Recovery Act ($787 billion), which stimulated the economy and was generally credited with ending the Great Recession. Obama’s stimulus was largely directed at businesses and industry. Expansionary fiscal policy is an increase in government purchases of goods and services, a cut in taxes, or an increase in government transfers. The 2009 stimulus (or the Recovery Act) was a combination of all three. The 2022 stimulus checks appear to be the first time the US government sought to affect the economy directly by handing cash to consumers.(2)
During 2020 a negative shock to aggregate demand was observed by economists, followed by a negative shock to aggregate supply.
“We proceed to study output and price fluctuations during the COVID-19 pandemic. We attribute two thirds of the decline in 2020:Q1 GDP to a negative shock to aggregate demand. In contrast, regarding the staggeringly large decline in GDP in 2020:Q2, we estimate two thirds of this shock was due to a reduction in aggregate supply. Statistical analysis suggests a slow recovery due to a persistent effects of the supply shock, but surveys suggest a somewhat faster rebound with a recovery in aggregate supply leading the way” (3)
Ricardian equivalence says that consumers will predict future contractionary policy as an effect of expansionary policy, and so will save their money which will negate the effect of the expansionary policy. This is said to only be true during times of low unemployment. During times of high unemployment this is not true, because people will spend their stimulus money and won’t be able to save it. Regardless of this fact, will the US be headed towards contractionary fiscal policy in the future? Let’s look at the trends.
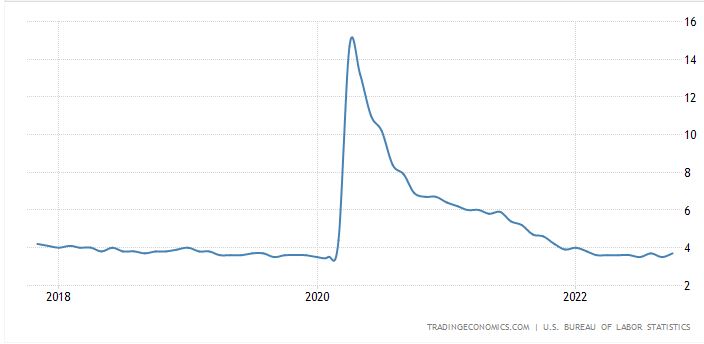
Chart 1: US Unemployment Rates 2018-Present (Nov 2022). (4)
In 2020 unemployment spiked, and while in the past the US has decided to battle inflation and allow unemployment, this case appears to be the opposite. For some, the amount paid by unemployment became larger than the amount they had ever been paid by working a job for forty hours per week. Since they were not required to look for a job, they had no incentive to. Since they were not seeking work, technically they should not have been counted as unemployed, and so the above figure may not be an accurate representation of unemployment during the pandemic. The stimulus checks and other policies were aimed at reducing unemployment, which classically would lead to higher inflation as a result.
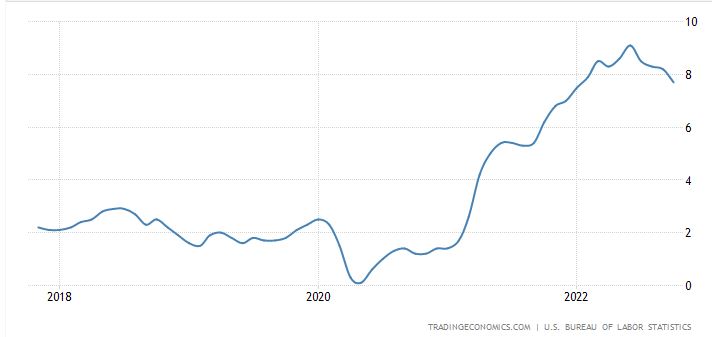
Chart 2: US Inflation Rates 2018-Present (Nov. 2022).
As the chart above shows, inflation did increase drastically between 2020 and 2022 and continued to rise. It is possible that this happened due to policies aimed at curbing unemployment. The effects of these policies aren’t perfectly predictable. There is a danger that stabilization policy will do more harm than good. Attempts to eliminate inflationary gaps usually rely on monetary rather than fiscal policy by raising or lowering interest rates.(2)
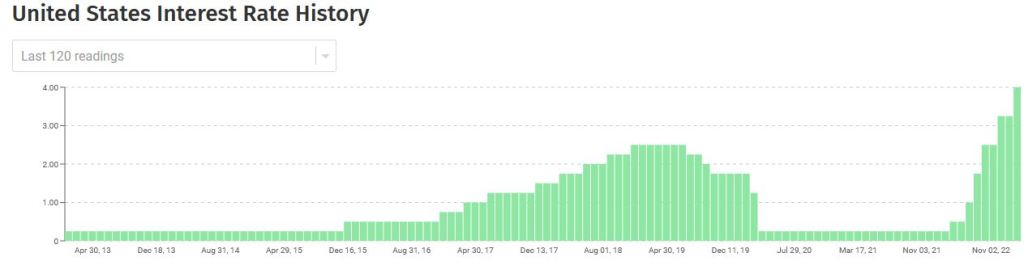
Chart 3: US Interest Rates 2013-Nov 2022. (5)
Interest rates sharply dropped in 2020, evidently due to a recessionary gap caused by a negative demand shock. Starting in 2021 interest rates were raised in a manner that resembles the increase in inflation, so it seems the raising of interest rates was an effort to combat inflation. With higher inflation comes a reduced value of money which means the reduced ability for the government to repay its own debt may lead to an impact on their credit rating.

Chart 4: US Credit Rating by 4 Major Agencies, by Year, 1949-July 2022. (6)
In late 2020 the credit rating of the USA had a negative outlook, but by 2022 retained a general AAA rating and did not become downgraded again, as it did in 2011 by S&P. The US dollar being used as a global currency of trade and by some foreign nations for their money supply, it is pivotal for many that the US credit rating remain top-notch.
It is unclear at this time whether all of these fiscal and monetary policies will work to stabilize the economy, or if the US is headed towards hyperinflation. Regardless, the fiscal policy of seeking to achieve stabilization of aggregate demand by granting citizens stimulus checks appears to have worked at least temporarily, to offset a negative demand shock. It is unclear whether other factors contributed to this success. The move was rather desperate and could possibly backfire, and only time will tell.
Resources
1) Teague, K. Smith, D. Dec. 2020. New stimulus package versus CARES Act: What’s different this time? https://www.cnet.com/personal-finance/your-money/new-stimulus-package-versus-cares-act-whats-different-this-time/
2) Krugman, P. Wells, R. 2020. Essentials of Economics, 5th Ed. ISBN-13: 978-1-319-22131-7.
3) Geert Bekaert, Eric Engstrom, and Andrey Ermolov. June 2020. Aggregate Demand and Aggregate Supply Effects of COVID-19: A Real-time Analysis. Link: https://www.federalreserve.gov/econres/feds/aggregate-demand-and-aggregate-supply-effects-of-covid-19-a-real-time-analysis.htm.
4) The US Bureau of Labor and Statistics. https://www.bls.gov/.
5) FX Empire. FXEmpire.com.
6) World Government Bonds. Worldgovernmentbonds.com.
